
With timeline views, CPU load graphs, and support for custom tracepoints, it offers powerful diagnostics out of the box—no license required, optional upgrades enable deeper analysis with live streaming, memory profiling, and more.
Embedded systems visibility just got a major upgrade. Percepio, a leading name in embedded and IoT trace diagnostics, has launched Percepio View, a free trace visualisation tool tailored for the Zephyr RTOS. The tool gives developers instant insights into system behaviour with no cost or licensing barriers.
Backed by the Linux Foundation’s Zephyr Project, the release is expected to significantly boost accessibility to advanced observability tools. This empowers developers with real-time insight, which leads to more reliable and efficient Zephyr-based applications Feature rich, developer-friendly it offers a streamlined yet professional experience. The key features are:

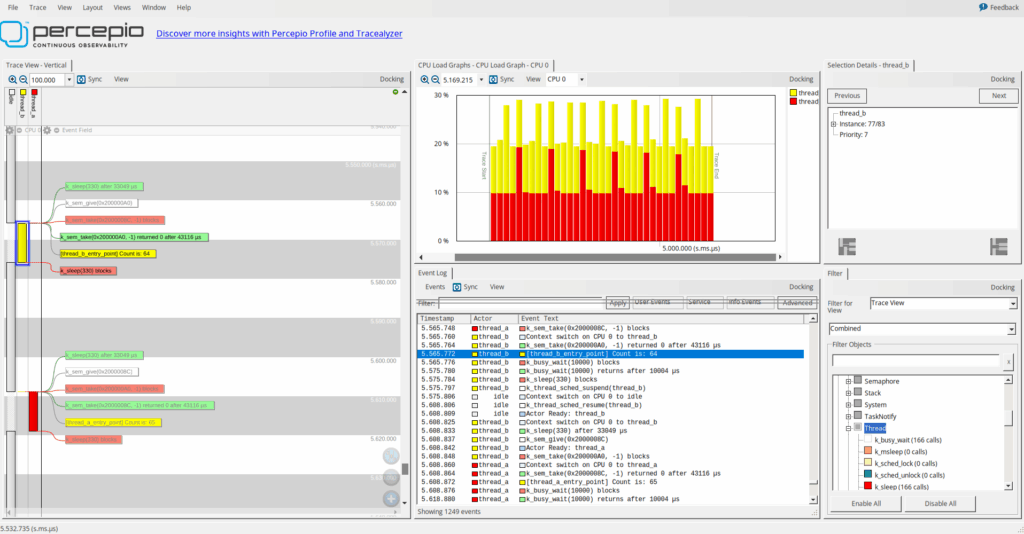
- RTOS-aware timeline visualizations
- CPU load graphs and task execution analysis
- System and user event logs
- Support for custom tracepoints
All users can access these core features for free, with registration unlocking bonus capabilities. For developers needing deeper trace analysis and longer trace durations, Profile is available as an optional upgrade.It includes live streaming for long-term trace capture, thread execution metrics for detailed timing analysis, memory usage profiling to track resource consumption, and visual plotting of custom application variables to aid in performance tuning and debugging.
“Visibility is critical in embedded development,” said Johan Kraft, CTO and founder of Percepio. “Percepio View provides powerful trace diagnostics for every Zephyr developer—making it easier to understand, debug, and optimize systems from day one.”
For more information, click here.